UI Debug Tools
Inspect the Generated HTML of a Control
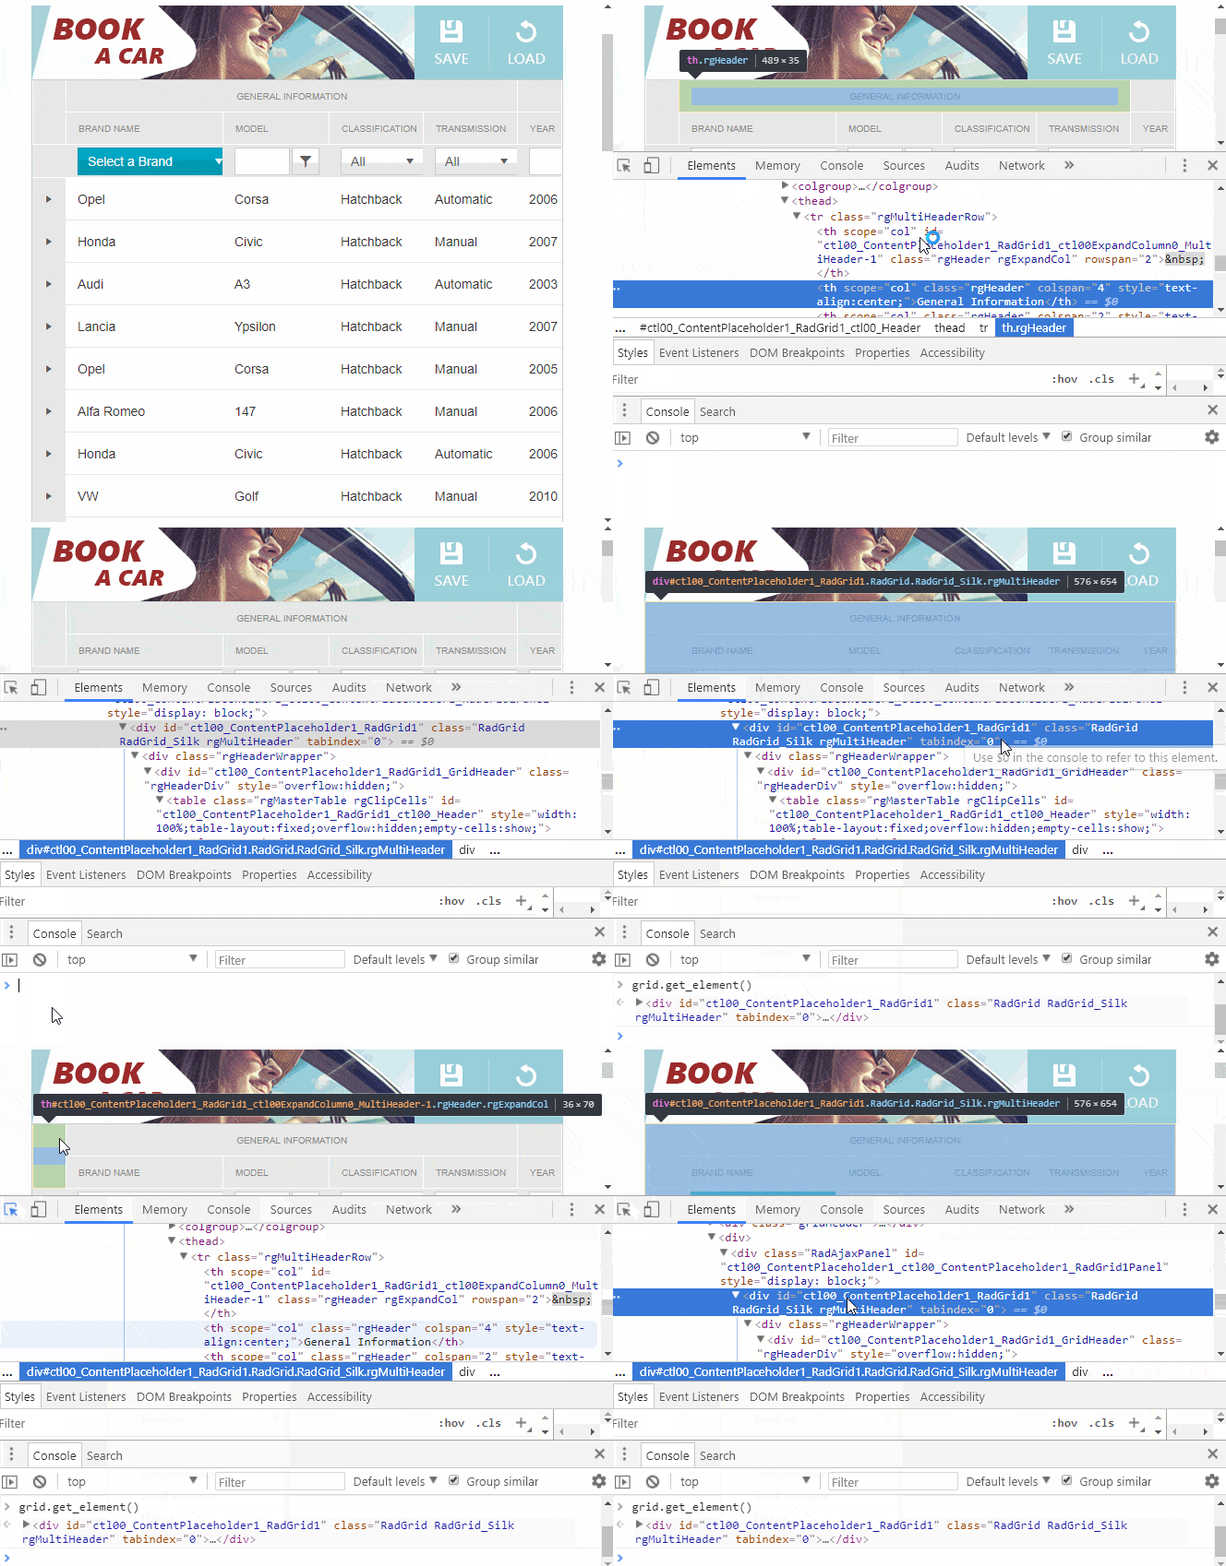
Right-click an element and select the Inspect Element from the context menu. That will open Chrome DevTools and highlight the element that you clicked on.
Click the Inspect Element button (Ctrl+Shift+C) inspect-icon on the top left corner of Chrome DevTools and hover over the control.
Right-click on an element logged in the console and choose "Reveal in Elements panel."

See the Applied Styles
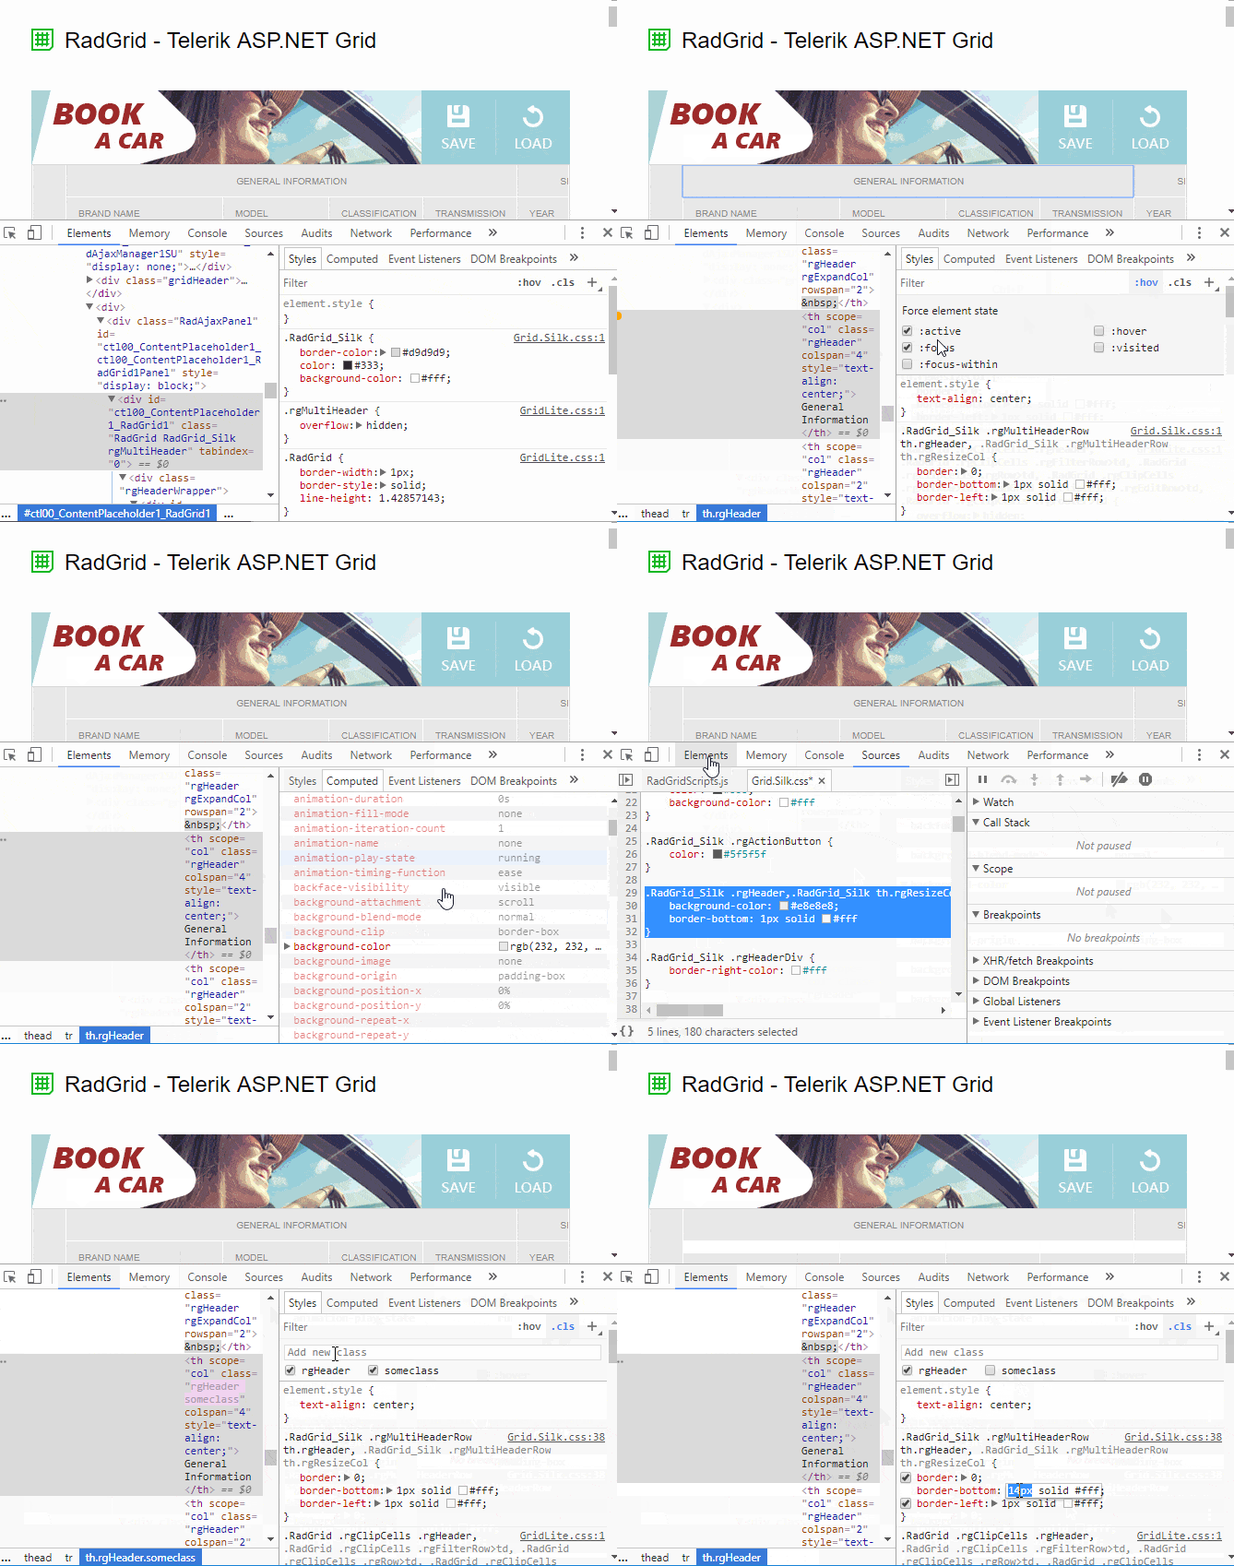
When styling the page, sometimes you need to tweak the rules like padding, margin or color a little to get the perfect appearance. The side bar of the Elements panel has the Styles and Computed tabs, which allow you to dynamically change the applied styles to the selected element in the Elements panel, and even find the origin of the style rule. It also allows you to filter the styles, force different states (:hov) such as hovered, active, focused, add/remove classes easily (:cls). This is also useful in scenarios where the layout or appearance of the control is broken to find out which style is breaking the design.

Tips
- You can use the keyboard arrows to increase/decrease numeric values.
- You can use the color picker when setting color values to some properties.

Reference
https://www.telerik.com/blogs/improve-your-debugging-skills-with-chrome-devtools